On Swimming Naked and Tides
Vulnerable asset managers are in for a world of pain when markets turn from bull to bear
June 2019
Highlights
As the current bull market enters its 11th year, we raise the question: which asset managers are positioned for the inevitable bear market? Warren Buffet once noted, “You only find out who’s swimming naked when the tide goes out.” With due respect to Mr. Buffet, put on your goggles, because we’re about to dive below the surface and find out exactly who’s swimming naked before the tide goes out. We study the largest 25 asset managers and assess their fee sensitivity to market downturns in various asset classes. Our key findings include:
Of the largest 25 asset managers, those most reliant on capital appreciation for growth could expect to lose 15% or more in fee revenue in the next bear market.
Asset managers have significant variation in fee exposure to various asset classes, resulting in large differences in sensitivity to different asset class declines.
Jackson National and T. Rowe Price are both particularly vulnerable to equity market downturns due to their high exposures to equities and a reliance on capital appreciation.
Asset managers need to diversify their product lineup with differentiated fund products to enable growth in all market conditions and assuage investor fears that a fund family is at-risk in any particular market environment.
Our universe
The analysis that follows covers the global universe of open-end funds, closed-end funds and exchange-traded funds and investment trusts. Notably excluded are separately managed accounts which comprise a meaningful portion of global assets.
We draw conclusions from this analysis on the assumption that the distribution of assets among these excluded product types is similar to the distribution of assets for the included product types. This assumption is likely to be more valid for some asset managers than others.
Asset allocations vary widely among managers
You might assume that all asset managers above a certain level of assets have similar distributions of assets across asset allocations. It’s a reasonable assumption given that to service hundreds of billions, or trillions of dollars in assets you might need to appeal to a wide range of investors with a wide range of products. But you would be wrong. Asset managers are as varied as snowflakes – no two exactly alike.

Figure 1: Distribution of net assets across asset classes for the top 25 asset managers by fees
The distribution of fees across asset classes mirrors that of assets with wide variation. Among the 25 largest asset managers, fee exposure to US stock range as high as 60% and as low as 0% and allocations to US bonds range from 4% to 100%. Accordingly, these firms have very different economic exposure to capital appreciation in different asset classes.

Figure 2: Distribution of fee revenue across asset classes for the top 25 asset managers by fees
While these exposures have remained relatively constant through time, we have seen a steady increase in allocation to US stocks and US bonds at the expense of non-US bond and other asset classes.

Figure 3: Global distribution of fee revenue today, 3-years ago, and 5-years ago
A simple indicator of vulnerability
The difference between organic growth rates and asset growth rates can only be explained by capital appreciation. The larger this gap, the more reliant a fund family has been on capital appreciation for its growth. This can give rise to vulnerability since market returns can be much more volatile than investor fund preferences.
| Total Asset Growth | Organic Growth | Difference | |
|---|---|---|---|
| Fidelity | 55.4% | -3.3% | 58.7% |
| T. Rowe Price | 30.1% | -9.9% | 40.0% |
| Janus Henderson | 15.1% | -22.2% | 37.3% |
| Dodge & Cox | 26.8% | -7.7% | 34.5% |
| Jackson National | 19.7% | -13.5% | 33.2% |
| Schwab | 118.9% | 86.8% | 32.1% |
| Vanguard | 61.6% | 30.4% | 31.2% |
| American Funds | 36.5% | 8.6% | 27.9% |
| Dimensional | 50.8% | 24.1% | 26.7% |
| MFS | 24.5% | -0.9% | 25.4% |
| State Street | 47.1% | 22.7% | 24.5% |
| Franklin Templeton | -6.2% | -25.9% | 19.7% |
| Invesco | 21.6% | 2.8% | 18.8% |
| iShares | 69.2% | 51.0% | 18.2% |
| PIMCO | 37.5% | 20.9% | 16.7% |
| AXA | 1.1% | -11.7% | 12.8% |
| UBS | 19.5% | 12.8% | 6.6% |
| JPMorgan | 11.0% | 7.2% | 3.8% |
| DWS | -7.1% | -10.9% | 3.8% |
| Credit Suisse | 9.7% | 6.0% | 3.8% |
| Nomura | 47.3% | 44.3% | 3.0% |
| BNP Paribas | 3.8% | 0.9% | 2.9% |
| Amundi | 1.1% | 1.0% | 0.2% |
| Natixis | -6.9% | -4.6% | -2.3% |
| BlackRock | 16.2% | 18.5% | -2.3% |
Figure 4: Trailing 3-year difference in asset growth and organic growth rates for the largest 25 asset managers
The discrepancy between these rates becomes particularly concerning when organic growth is negative because an inability to generate capital appreciation in the future could lead to overall assets shrinking in bear market conditions.
Flows follow performance
It’s well understood that funds that exhibit strong investment performance subsequently benefit from net inflows as new investors chase what they perceive as investment skill. It’s important that we include this relationship in our analysis of which fund families are most at-risk during inevitable market declines. Although Investment performance horizons up to 10 years and beyond influence investor decisions, shorter time periods have a greater impact on flows.

Figure 5: Impact of investment performance over various time horizons on subsequent organic growth rates
Similarly, a fund’s asset class is a large determinant of how well it will be rewarded or punished for its past performance. We find flows to bond funds, where consensus wisdom seems to be that active managers are better able to outperform passive benchmarks, have significantly more sensitivity to investment performance than stock funds.

Figure 6: Slope coefficient between trailing 1-year return and subsequent 1-year organic growth rate by asset class
We will incorporate these asset-class relationships between investment performance and subsequent organic growth in our sensitivity and scenario analysis. However, performance is not exclusive in its influence over future organic growth rates. Product characteristics (fees, category, management team), distribution characteristics (main channel, distribution team skill), and the parent company’s brand recognition can all sway organic growth, and we must account for these characteristics as well.
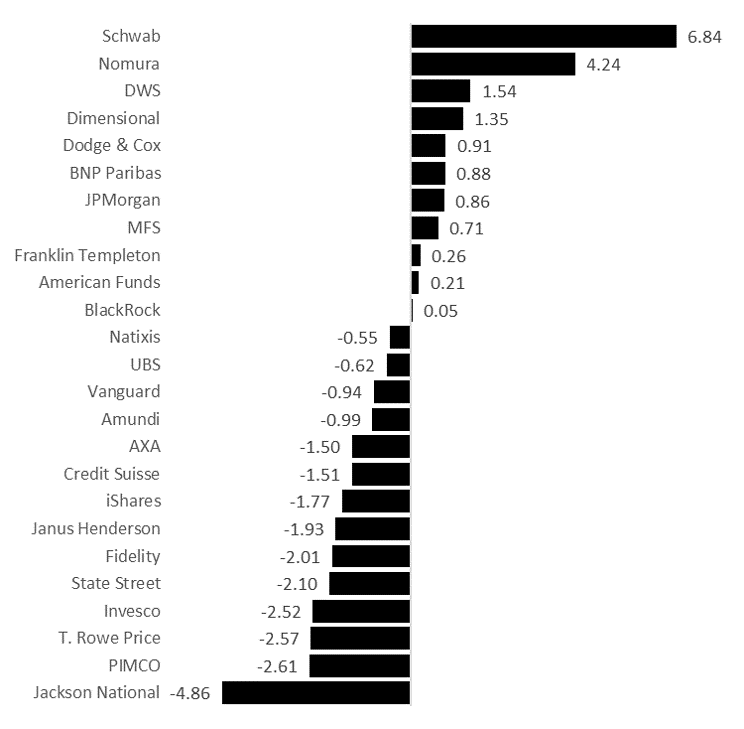
Figure 7: Organic growth not determined by investment performance over the last 12 months for the 25 largest asset managers
Schwab benefits the most from non-investment performance-related characteristics, while Jackson National suffers the most. In Schwab’s case, both low fees and distribution skill contribute significantly to its 6.8% organic growth tailwind.
Sensitivity analysis
By combining asset managers’ fee allocations by asset class, the relationship between asset class returns and subsequent flows, and how asset managers’ organic growth is under-/out-performing their asset class today, we can estimate each asset manager’s sensitivity to market downturns in each asset class.
In these sensitivity analyses, we make the unrealistic assumption that downturns in each asset class are isolated, e.g. a US Stock market downturn does not imply a concurrent movement in any other asset class. This assumption, while unrealistic, is useful in allowing us to assess each fund family’s pure sensitivity to the returns of each asset class.
Notably, Schwab is the least sensitive of all 25 managers to declines in Non-US Stocks, US Bonds, and Non-US Bonds. On the opposite end of the spectrum, Jackson National is the most sensitive manager to declines in both US Stocks and Non-US Bonds.

Figure 8: Total fee growth for the 25 largest asset managers in the event of various market declines. From left to right: US Stocks decline 20%, Non-US Stocks decline 20%, US Bonds decline 5%, Non-US Bonds decline 5%.
A more realistic stress test
Now that we understand which managers are most exposed to each asset class, we can develop more realistic scenarios in which asset class returns are correlated, and a downturn in one will coincide with a downturn in another. Using the distributional assumptions below, we’ve generated 10,000 simulated scenarios for market returns.
| Correlation | US Stock | US Bond | Non-US Stock | Non-US Bond |
|---|---|---|---|---|
| US Stock | 1.00 | |||
| US Bond | 0.30 | 1.00 | ||
| Non-US Stock | 0.69 | 0.22 | 1.00 | |
| Non-US Bond | 0.21 | 0.05 | 0.31 | 1.00 |
| Mean | 10.0% | 5.4% | 11.1% | 5.6% |
| Std.Dev. | 18.8% | 4.4% | 21.7% | 5.0% |
Figure 9: Summary statistics for market returns simulation.
While any market assumptions can be quibbled with, we’ve chosen to keep our simulation simple to avoid unnecessarily complicated assumptions. Under these assumptions, we can determine total asset growth rates for the 10th percentile scenario for each fund family. In other words, the largest 25 fund families should expect to have fee growth below these levels in one out of every 10 years.

Figure 10: 10th percentile of fee growth for each asset manager under our simulated conditions
We can dissect any one fund family to further understand its result. Jackson National, for example, ranks as the most vulnerable fund family in our universe, and should expect to lose more than 15% in asset management fees once every 10 years.
This is because Jackson National has high (although not the highest) exposures to US and Non-US Stocks, which of course are more volatile than bonds. In addition, their other non-performance-related fund characteristics contribute to -4.9% fee growth annually. This is the largest hole that any of the largest 25 asset managers must dig themselves out of.
Conclusion
You better start swimmin’ or you’ll sink like a stone – for the times they are a-changin’
- Bob Dylan
How long will the bull market last? Well, we’re not market prognosticators, but we feel 100% confident in our answer: not forever. So the logical question remaining is which asset managers are best positioned to weather a market downturn. We’ve highlighted the asset managers we think are vulnerable.
Fortunately, as the tide has yet to go out, asset managers have some time to course correct. There is nuance to behold below the coarse asset class buckets. While it would be difficult for asset managers to move investors across their investment products to less risky asset classes, portfolio managers can shift assets to less risky securities within the asset class.
There are two key recommendations that will make asset managers less sensitive to market declines.
Diversify your product line-up. Although asset classes have been at the forefront of this paper, product diversification can occur at the category level, across the active/passive spectrum, across distribution channels, and across other product features like social responsibility. A diverse line-up, like a diverse portfolio, will help ensure that while some of your products are out of favor, others are in-favor, ultimately reducing growth volatility.
Differentiate your product line-up in a good, understandable, and believable way. Products that investors seek to fill a need because they understand and believe in its value proposition are poised to generate growth beyond what market performance could explain. This type of differentiation can take an asset manager off the roller-coaster that is performance-based flows.
References
Edelen, R. M. (1999). Investor flows and the assessed performance of open-end mutual funds. Journal of Financial Economics, 53(3), 439-466.
Friesen, G. C., & Sapp, T. R. (2007). Mutual fund flows and investor returns: An empirical examination of fund investor timing ability. Journal of Banking & Finance, 31(9), 2796-2816.
HUANG, J. , WEI, K. D. and YAN, H. (2007), Participation Costs and the Sensitivity of Fund Flows to Past Performance. The Journal of Finance, 62: 1273-1311. doi:10.1111/j.1540-6261.2007.01236.x
Ibbotson, R. G. (2019). Stocks, bonds, bills, and inflation: U.S. capital markets performance by Asset Class 1926-2015 Duff & Phelps. Hoboken, NJ: John Wiley & Sons.
Jonathan B. Berk & Richard C. Green, 2002. "Mutual Fund Flows and Performance in Rational Markets," FAME Research Paper Series rp100, International Center for Financial Asset Management and Engineering.
Long-Term Capital Market Assumptions. (2019). Retrieved from https://am.jpmorgan.com/gi/getdoc/1383581744857
Contributors
Warren Miller, CFA
Founder & CEO
warren.miller@flowspring.com
©Flowspring, Inc. All Rights Reserved. The information, data, analyses and opinions presented herein do not constitute investment advice; are provided solely for informational purposes and therefore are not an offer to buy or sell a security; and are not warranted to be correct, complete or accurate. The opinions expressed are as of the date written and are subject to change without notice. Except as otherwise required by law, Flowspring shall not be responsible for any trading decisions, damages or other losses resulting from, or related to, the information, data, analyses or opinions or their use. The information contained herein is the proprietary property of Flowspring and may not be reproduced, in whole or in part, or used in any manner, without the prior written consent of Flowspring.